PPF Status January 2015
January 2015 Review of the Pension Protection Fund Status
The PPF Purple Book report for 2014 shows that the s169 liabilities are £1,176.8 billion and the full buy-out liabilities are £1,690.3 billion. This means that PPF levels of compensation correspond to 70% of the normal pension. The difference is not due to differences in assumptions about life expectancy etc., but to compensation caps and the reduction in annual increases in the pension when PPF take over. The graphs below, based on the monthly reports from the PPF, show a further downturn in their finances. The number of schemes in the PPF index continues to fall as more and more are transferred into their tender embrace. For a year now, the overall funding ratio has been falling as assets rise steadily but much more slowly than liabilities (at about one-third of the rate of increase).
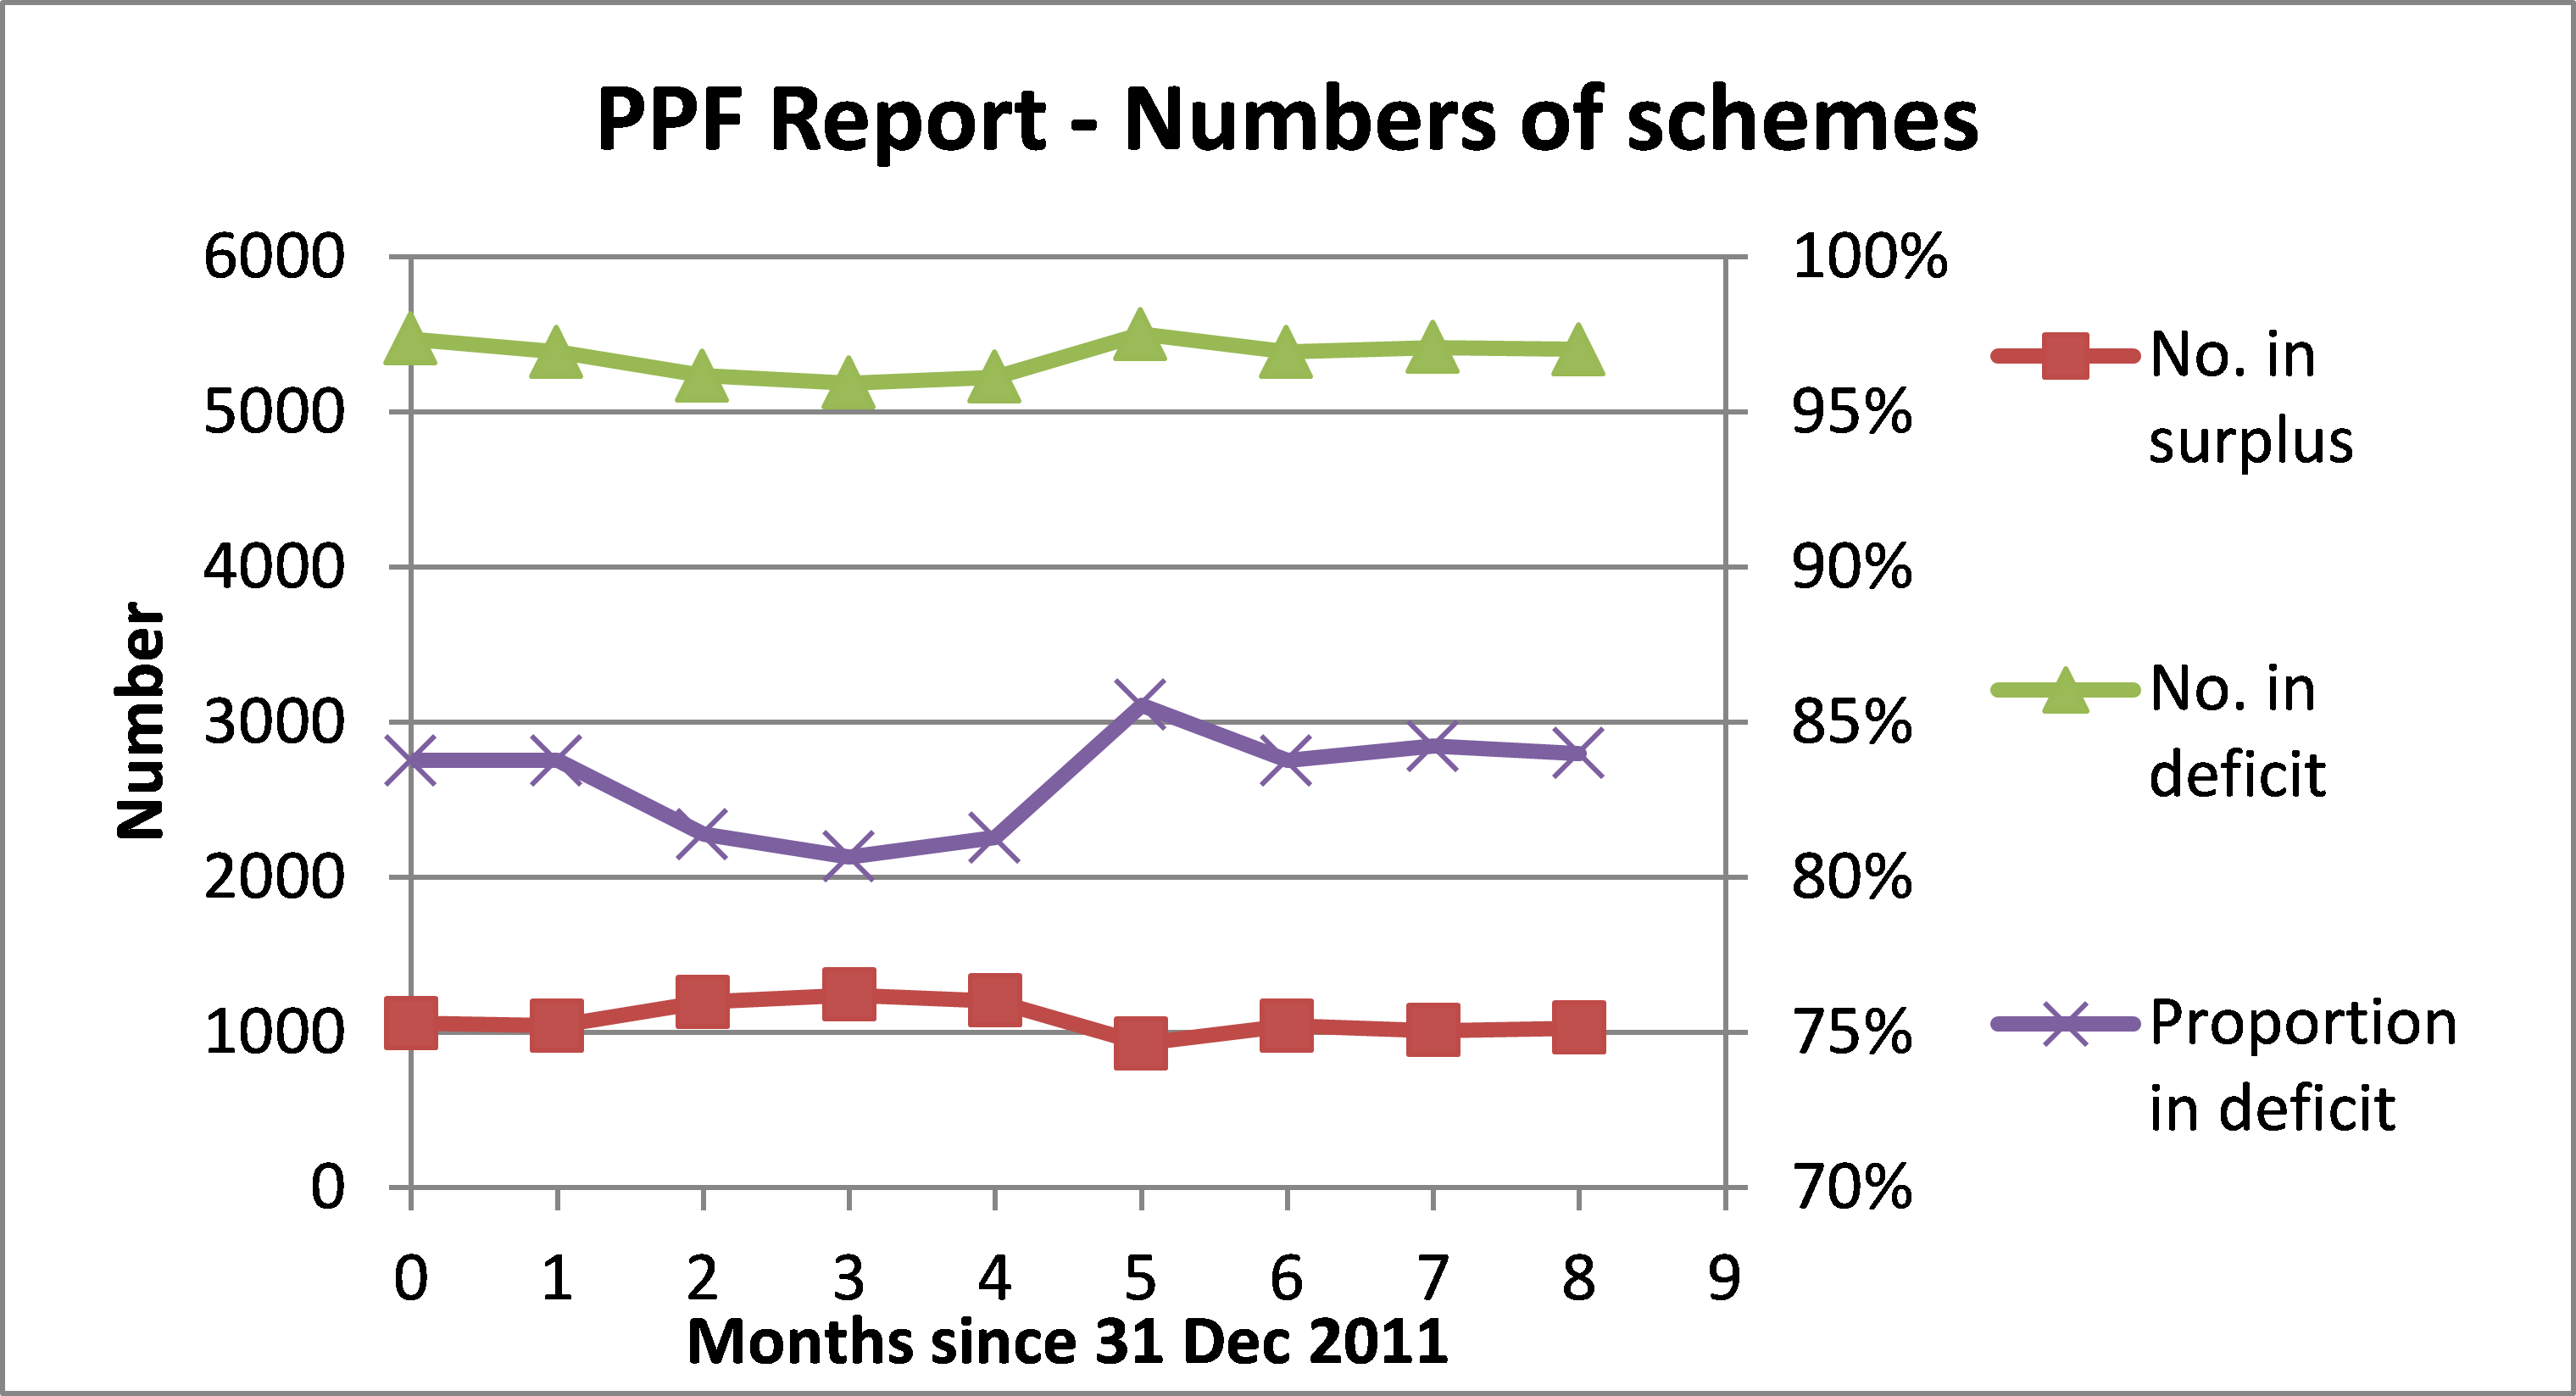
In these reports, the PPF continue to aggregate schemes in surplus with those in deficit, although this is not a sensible way of assessing the situation. When schemes are transferred to the PPF, their assets are transferred as well. But the only schemes that get transferred are those in deficit. The assets of the schemes in surplus remain with them, beyond the reach of the PPF.
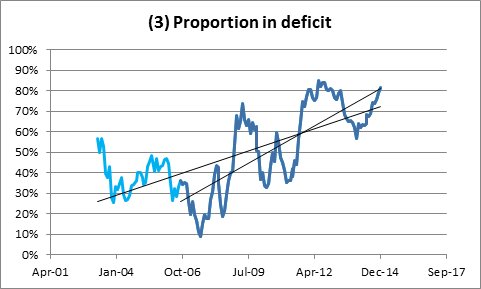
Thus, it would be more sensible to regard the schemes as two separate populations, those in surplus and those in deficit. This can be done using the longer term data on the 6,057 schemes provided elsewhere on the PPF website. This data set does not include the 1200 or so schemes which have been transferred in the last decade, and therefore in looking at them, we are looking at a data set in which the weakest schemes have already been eliminated – an optimistic view of life. We see that, since about August 2006, the proportion in deficit has been rising much faster than the longer term average. Not a good sign.
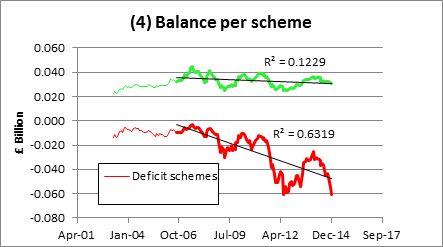
For each of the two populations, the net balance per scheme (assets less liabilities) is completely different. The balances of both are declining, but those in surplus are reducing at a far slower rate than those in deficit, and the trend in the deficit schemes is statistically significant. The average deficit of schemes in deficit is £50 million (the HPS is probably £500-600 million).
PPF now monitors 6,057 pension schemes, 1257 less than it did originally. Of these, 220 are still in assessment, but of those where a decision has been made, 79% have been transferred to the PPF, while the others have found better arrangements. However, the trend is clear: of those entering assessment, the proportion entering the PPF is steadily increasing, and is now close to 90%. On current trends, by 2030 (the PPF planning horizon), half of all the schemes in deficit will have transferred to the PPF. The combination looks lethal. Schemes are transferring to the PPF at an increasing rate, while their deficits are increasing steadily, and fewer schemes are left to pay the levies on which the PPF depends. While it is unlikely that the PPF will collapse entirely, the response to financial difficulties will be to further reduce levels of compensation, as they are entitled to do.
Ironically, one viable strategy for the PPF is to take over failing schemes as early as possible, before the liabilities they will have to take on exceed scheme assets by too large a margin. Indeed, from the tone of remarks made last year by PPF, it sounded as though they relished the prospect. If this is the real agenda set by the government, maybe we should be lobbying our MPs to reverse it. With liabilities of deficit schemes approaching £2 trillion by 2020, reducing payments to pensioners by 30% (£600 million) under the pretence of protecting them might be an attractive proposition.
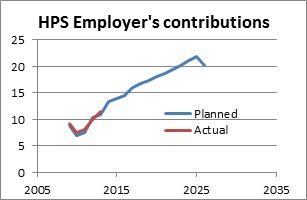
HPS Employer’s contributions
According to the annual reports by the HPS trustees, CH2M Hill have been maintaining contributions in accordance with the recovery plan set out in the 2008 Valuation Report. This is confirmed by the graph below, which shows the schedule of payments in the last column of the 2008 Valuation Report. As can be seen, this plan was back-end loaded, with the larger contribution payable towards the end of the plan. Current contributions, at £10 million, are still some way below the planned average of £15 million. Let’s hope they keep it up. However, it is likely that a new recovery plan would require increased contributions as, based on an analysis of past trends, the HPS deficit has probably increased since the last plan was approved by tPR.