Update From Pension Protection Fund
Update from Pensions Protection Fund
The PPF backstops the HPS in the event the scheme goes bust, but it is not guaranteed by Government. It is therefore in members interests to keep an eye of how the PPF itself is doing, so that if need be, we can raise our concerns with the Pensions Ombudsman. The PPF issues a monthly update of key statistics which the HPA has been monitoring on behalf of its members since December 2010. The full update is on the PPF 7800 page.
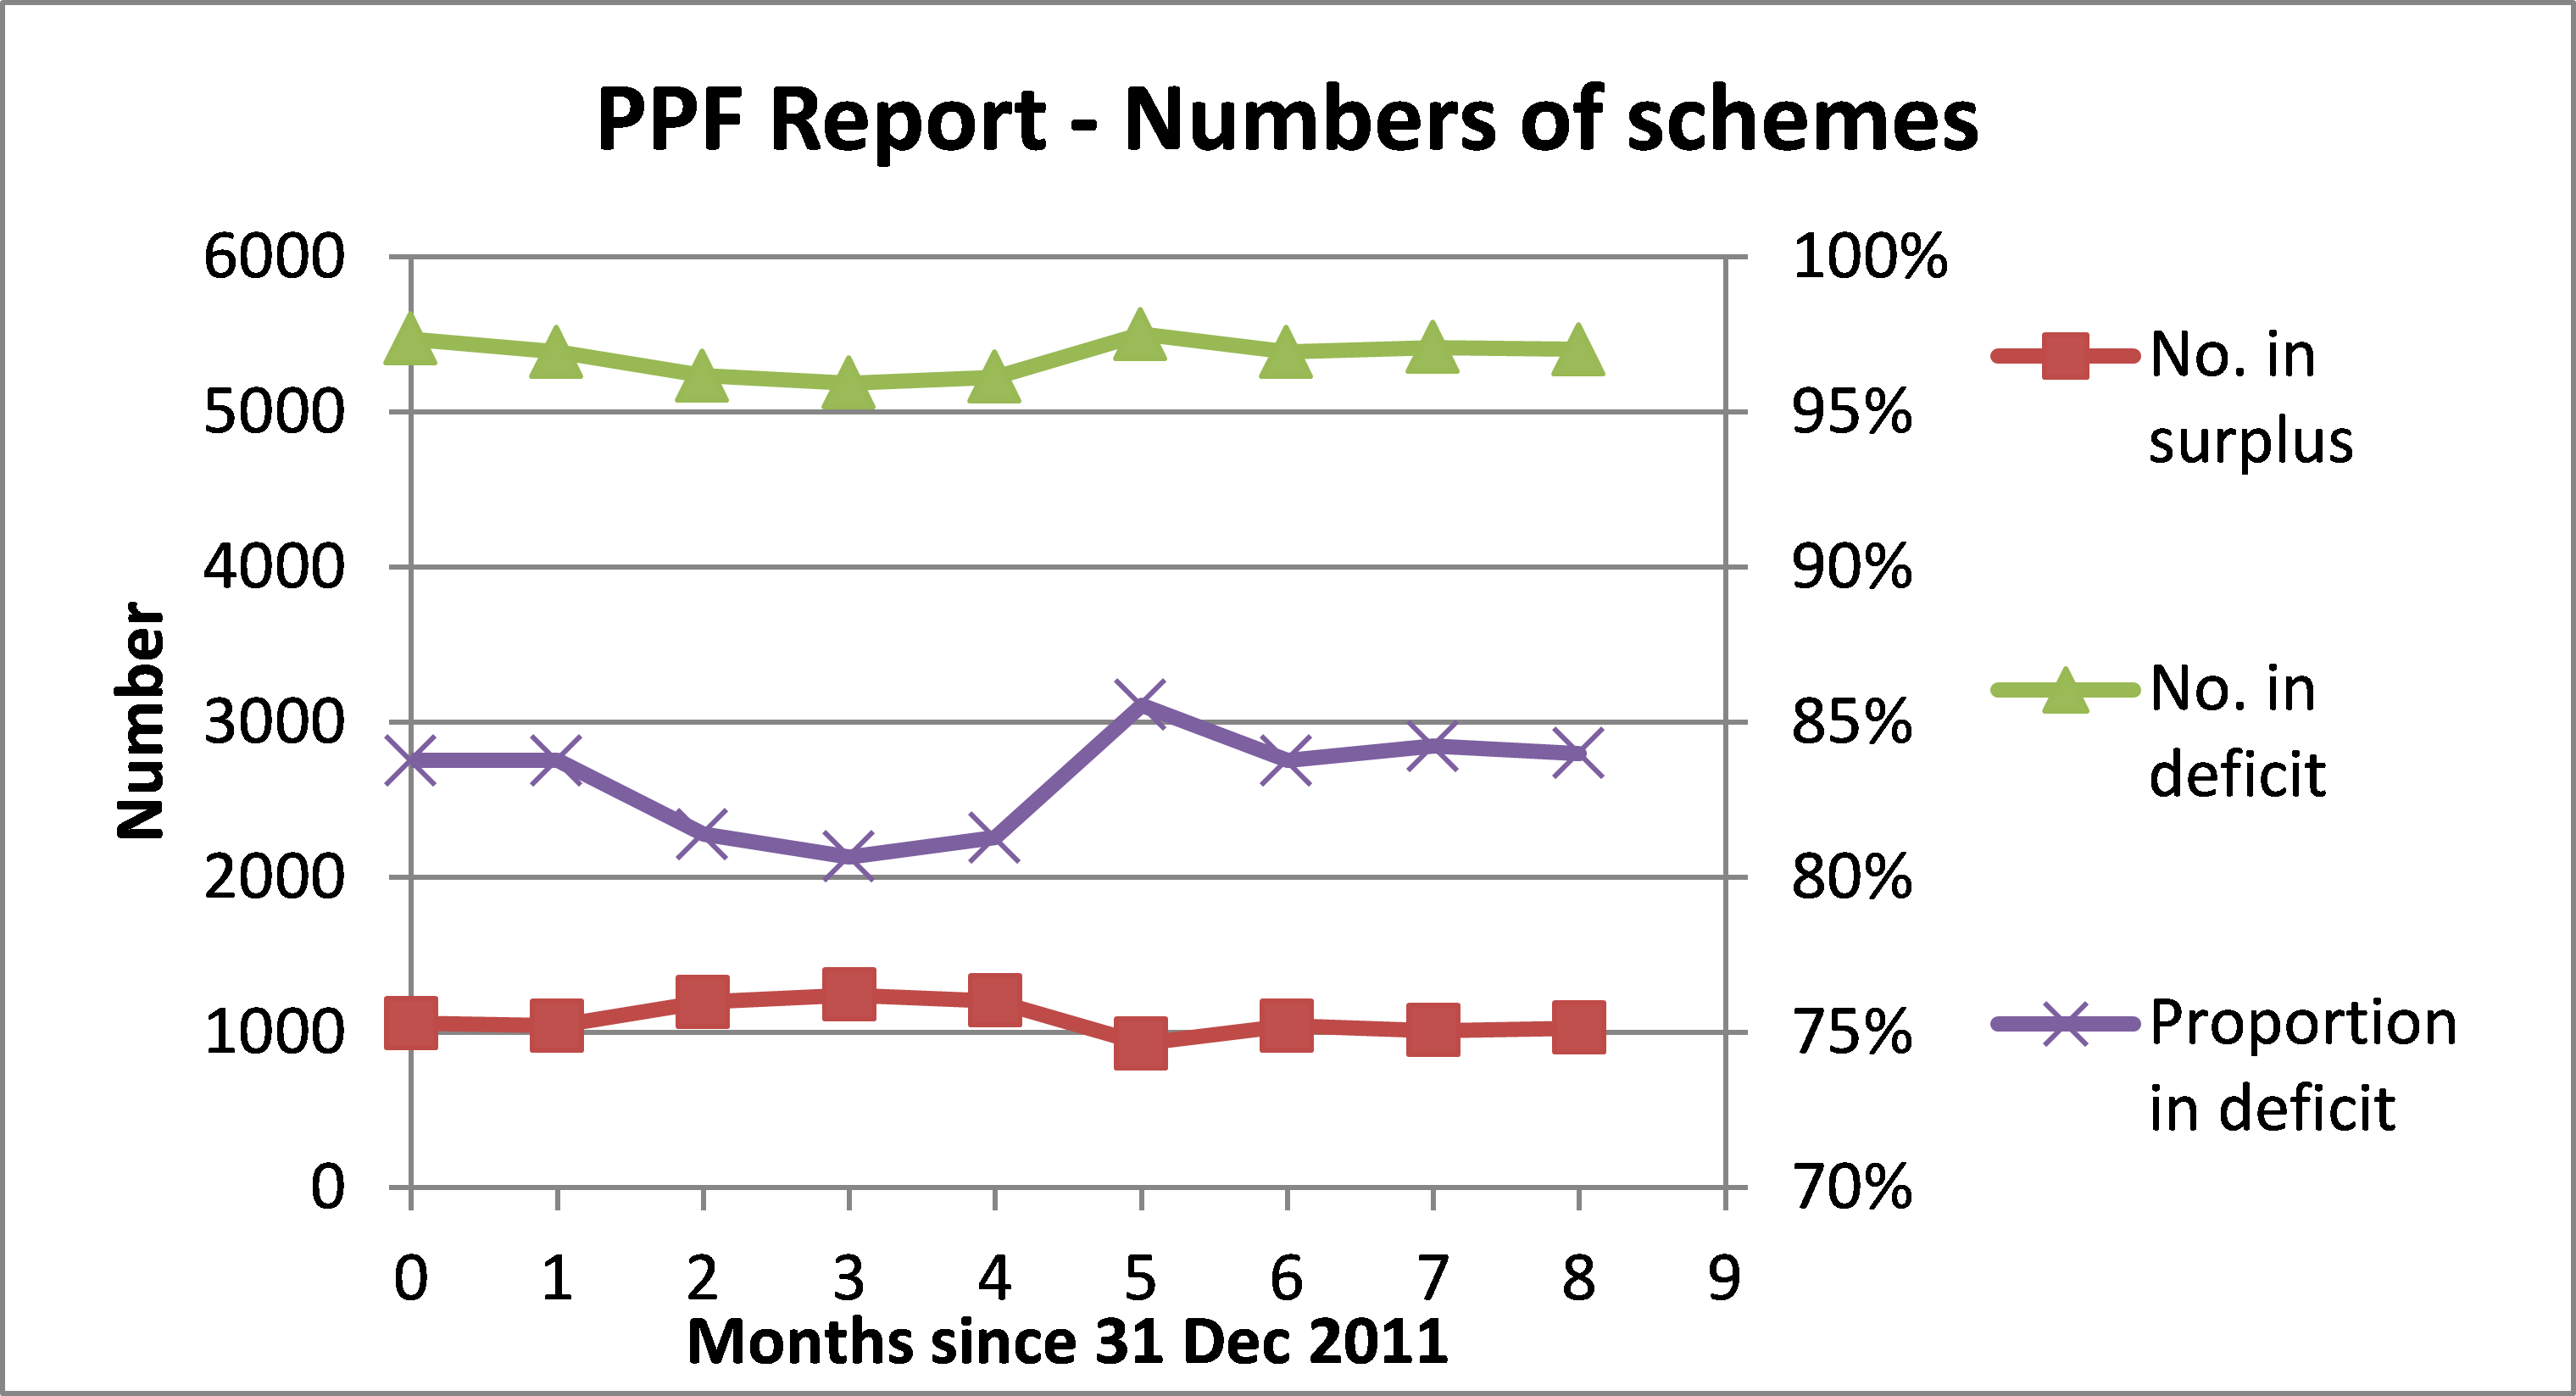
The key statistics give an overview of 6,432 pension schemes which are monitored. These vary greatly in size, with the HPS being among the larger schemes, so averages should be viewed with caution. In terms of numbers, the proportion of schemes in deficit reduced earlier in the year, but has since risen and for the last three months has stabilised at 84%, the same figure as in December.
In terms of money, the funding ratio (total scheme assets divided by total scheme liabilities) has also stabilised, but at a slightly lower level than in December. Some polarization seems to be taking place, with the rich getting richer and the poor getting poorer (no surprise there).
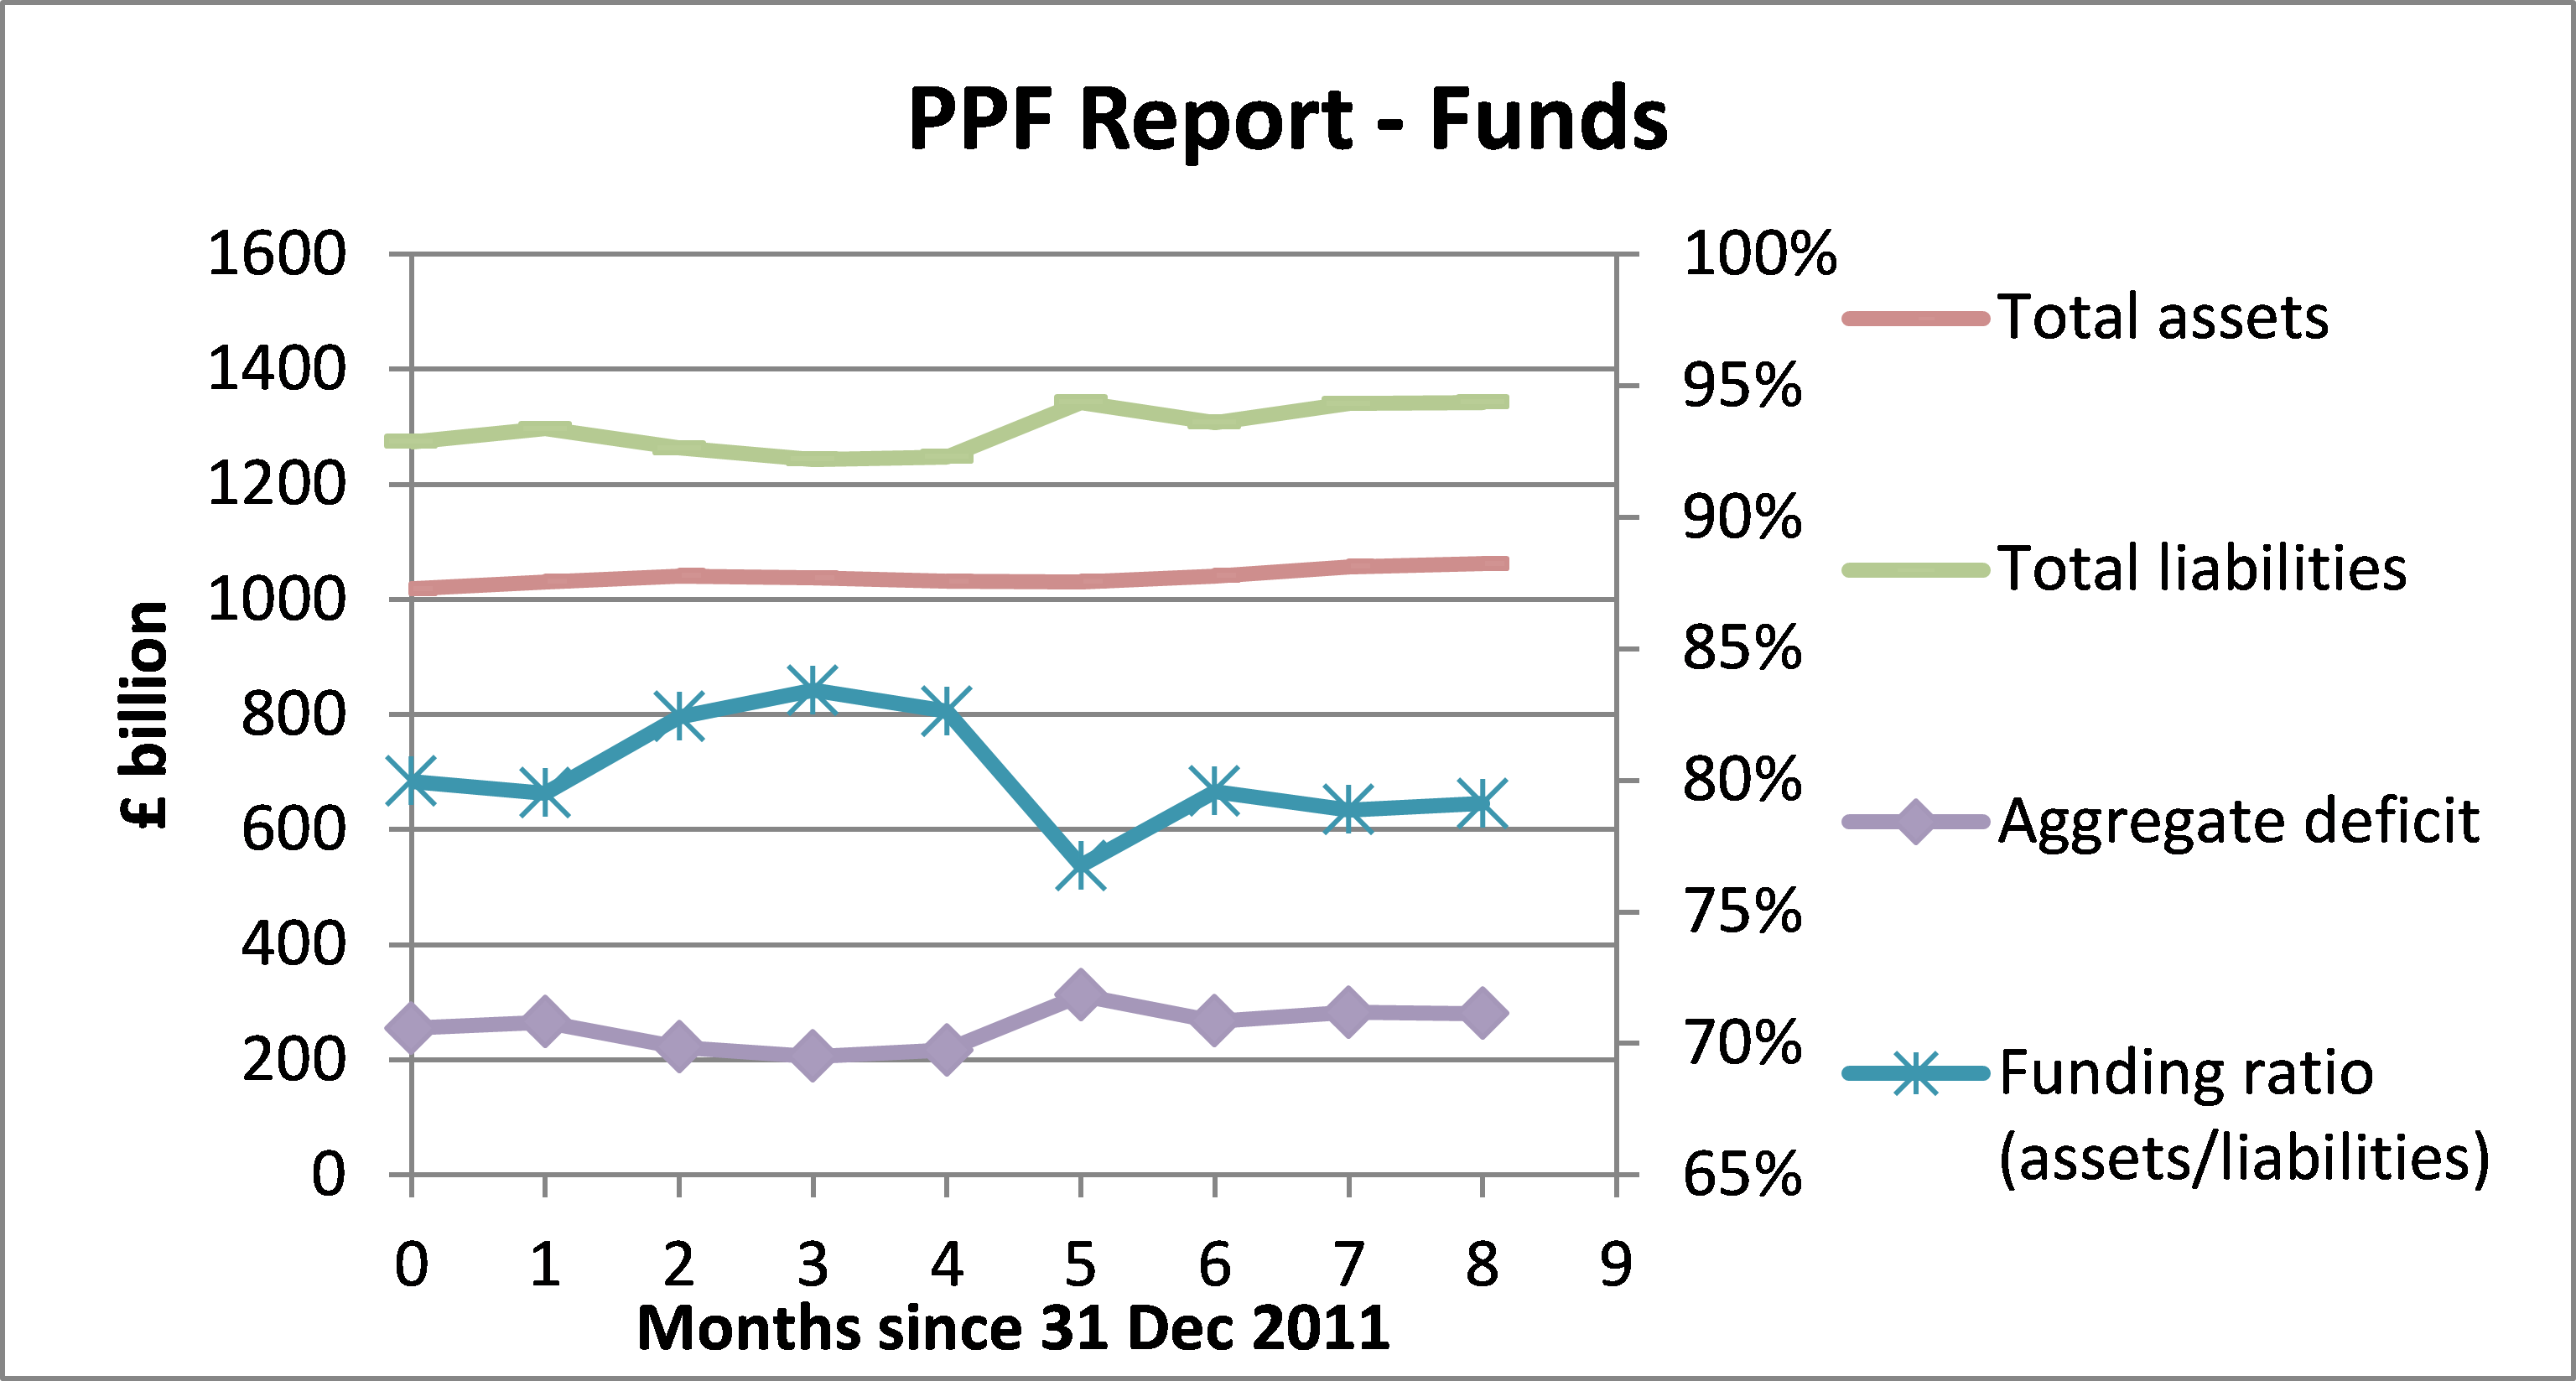
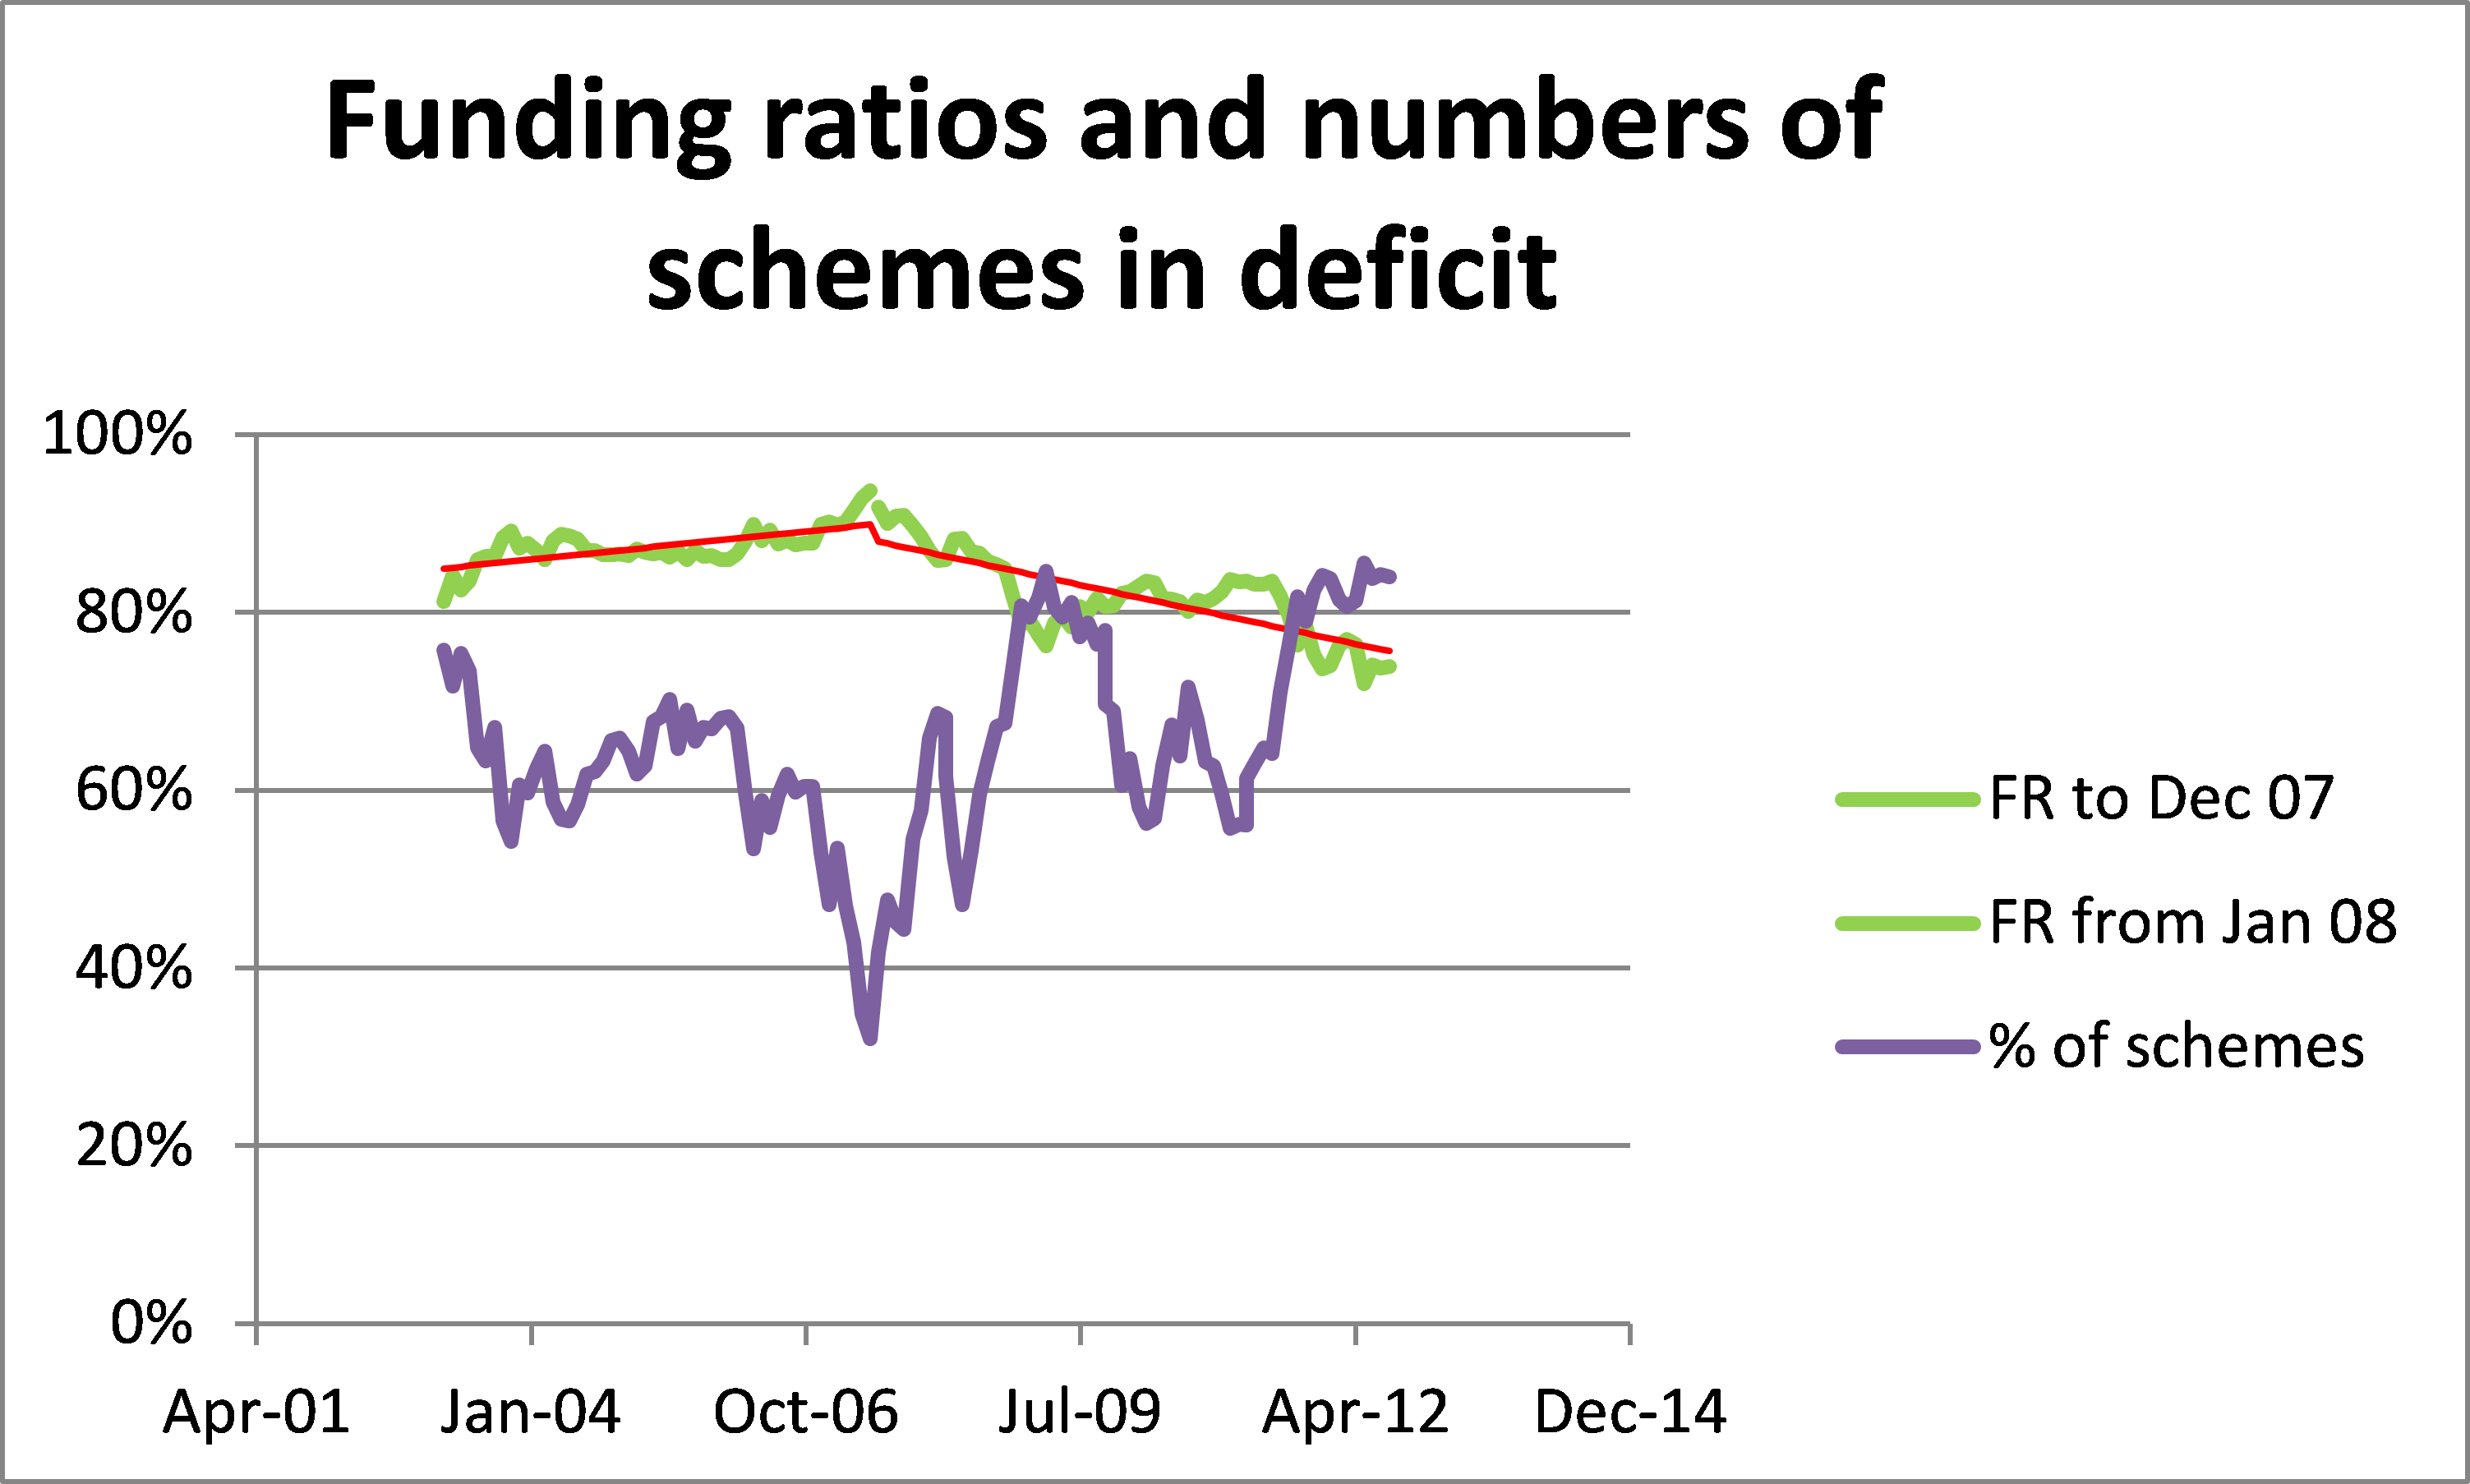
The assets per scheme in surplus have gone up from £0.96 billion to £1.03 billion, while the liabilities per scheme in deficit have also gone up from £0.23B to £0.25B. To analyse in greater detail the schemes which are in deficit, which are the ones liable to end up in the hands of the PPF, it is necessary to consult the PPF detailed reports (this being the most recent). These reports tabulate for each month since March 2003 the numbers, assets and liabilities of schemes in deficit (and also those in surplus). The basis of accounting has changes three times in this period, but the tables provide enough information to allow a back-projection estimate of the funding ratio on a uniform basis. The result, below, shows that conditions were improving until June 2007 but since then have deteriorated considerably, with the proportion of schemes in deficit increasing rapidly and the funding ratio falling. If these trends continue much longer, we may have cause for serious concern.
Since the HPS is one of the major schemes in deficit, with a particularly low funding ratio of 40% at the last valuation in December 2008, it will be of great interest to members to see the actuarial valuation for December 2011 and find out whether the HPS is also getting poorer. The communications from the Trustees since the takeover refer to scheme assets, which appear to have increased (good), but not to scheme liabilities, which, according to 2008 Actuarial Valuation Report (p14) are scheduled to peak in 2035, when annual outgoings will be double those in 2012. The HPS Report for 2011 (dated May 2012) anticipates that the deficit for December 2011 will have increased [compared with December 2008] but that by December 2012 a recovery plan will have been agreed with the new owners.
We eagerly wait to see whether the recovery plan is any better than the last two, both of which were back-end loaded and ended in the HPS being in worse shape than at the start of the recovery plan.